


As the saying goes, all real estate is local. Looking at housing data for Oahu overall can provide a good bird's-eye view of the market, but it's not always a good barometer of what's happening on your block. That's why in addition to crunching the monthly numbers for the Oahu market, Locations' Research Department also analyzes single-family home and condo local market areas—even drilling down to the island's 398 neighborhoods.
Our lead research analyst recently shared an update of what's happening on the ground in neighborhoods and local markets across Oahu. The below charts provide more detail about where prices, sales and listings are up (and down), as well as how housing supply affects demand in local markets across Oahu.
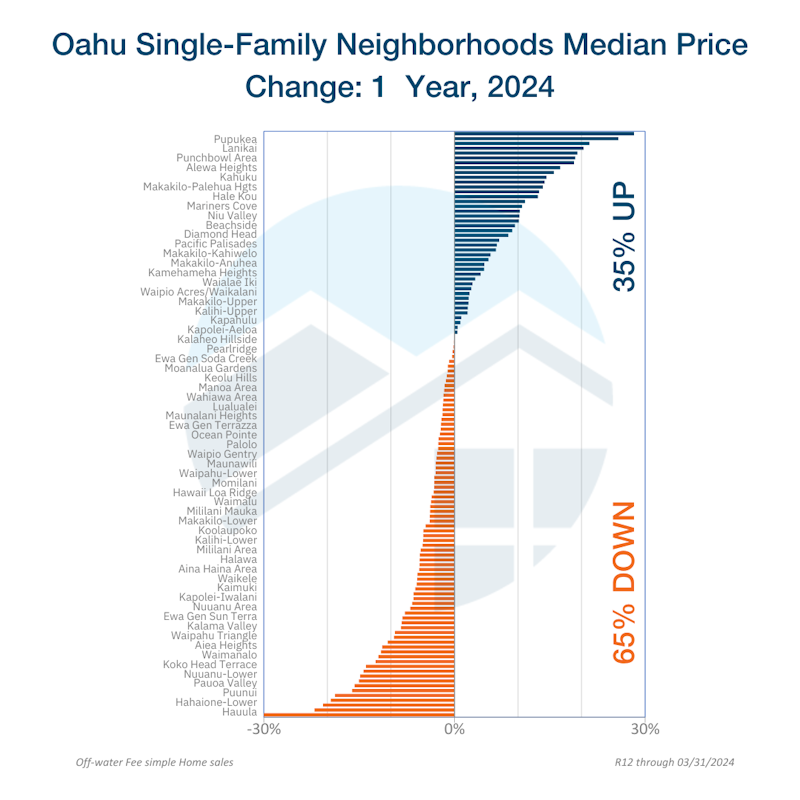
1. Oahu single-family home median prices are up year-over-year in more than one in three neighborhoods in 2024. The top three neighborhoods with the largest gain in median prices are:
- Pupukea, North Shore. Percent Change: +28% | 2024 Median Price: $2,825,000
- Halekauwila, Kaneohe. Percent Change: +26% | 2024 Median Price: $1,100,000
- Lanikai, Kailua. Percent Change: +21% | 2024 Median Price: $3,443,500
And the bottom three neighborhoods, with the largest declines in median prices, are:
- Hauula, Kaneohe. Percent Change: -32% | 2024 Median Price: $800,000
- Maikiki Heights, Nuuanu-Makiki. Percent Change: -22% | 2024 Median Price: $2,300,000
- Hahaione-Lower, Hawaii Kai. Percent Change: -21% | 2024 Median Price: $1,249,000
In the previous year, 79% percent of single-family home neighborhoods experienced price growth. However, falling prices are not a cause for concern, as most downward price adjustments have already passed. Looking at monthly trends year-to-date in 2024, Oahu home prices are already slightly above last year, with flat-to-slightly rising prices expected to continue throughout the remainder of 2024.
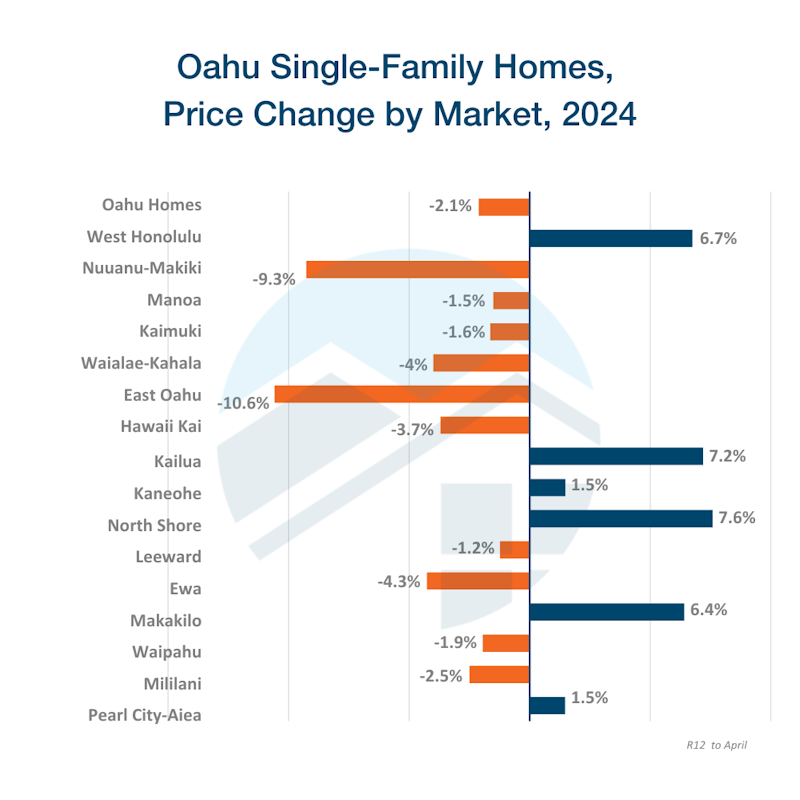
2. Zooming out to the market-area level, just a little more than one-third of single-family home markets experienced price increases in 2024. The biggest gains were in the North Shore and Kailua markets, with an increase of 7.6% and 7.2%, respectively. Median prices declined the most in the East Oahu and Nuuanu-Makiki markets, falling 10.6% and 9.3%, respectively. Markets with price decreases can mean opportunity for buyers, where properties may be more affordable than in previous years, and sellers may be more willing to make concessions.
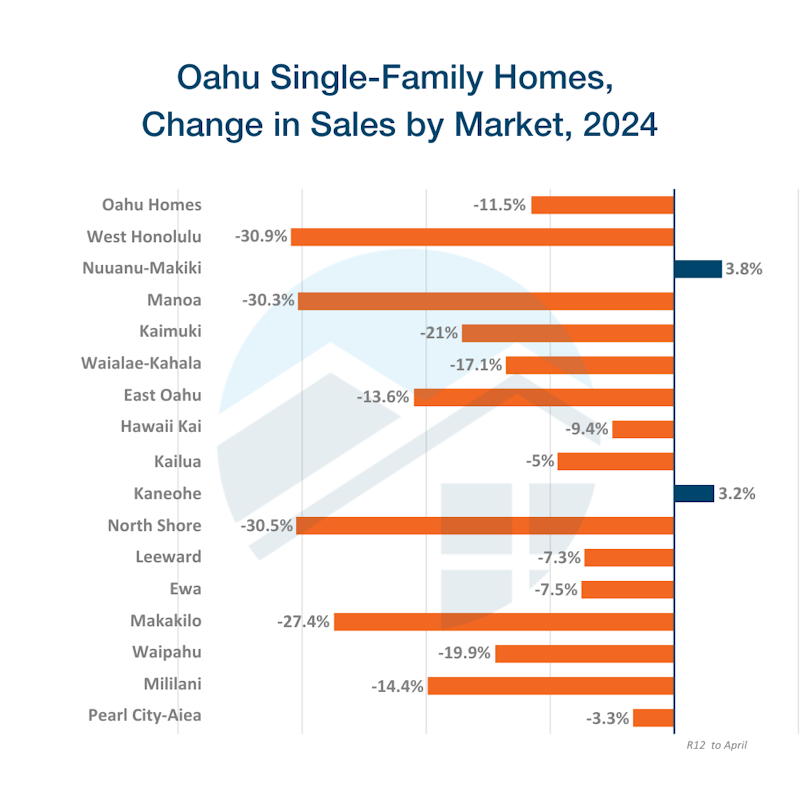
3. Home sales are down 11.5% overall, and all but two markets experienced lower sales than the same 12-month period in 2023. Only the Nuuanu-Makiki and Kaneohe home markets saw sales growth, by 3.8% and 3.2%, respectively. Sales fell by nearly one-third in the West Honolulu, Manoa and North Shore markets. The number of sales is one measure of demand, so sellers in markets with fewer sales should consult with a knowledgable Realtor to price their homes correctly and sell in as short a time as possible.
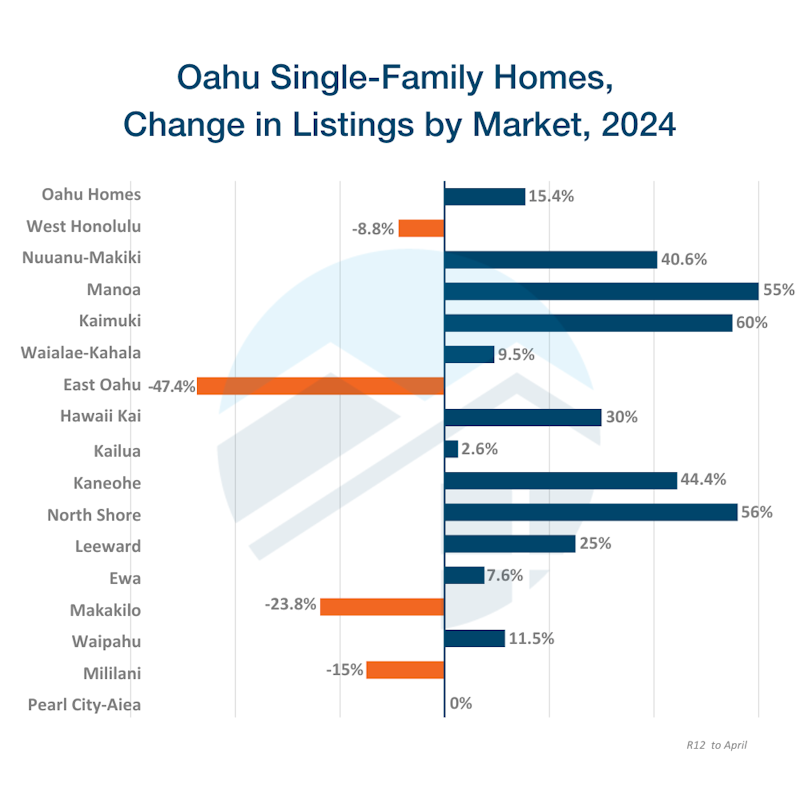
4. Single-family home listings are up 15.4% overall and in two-thirds of market areas. Although Oahu is still a sellers’ market, an uptick in listings offers homebuyers more choices and reduced competition. Manoa has 60% more listings compared to the previous 12-month period. The North Shore, with 56% more listings, and Kaimuki, with 55% more, have also seen significant growth in homes for sale. With nearly 50% fewer listings year-to-date, East Oahu is an outlier.

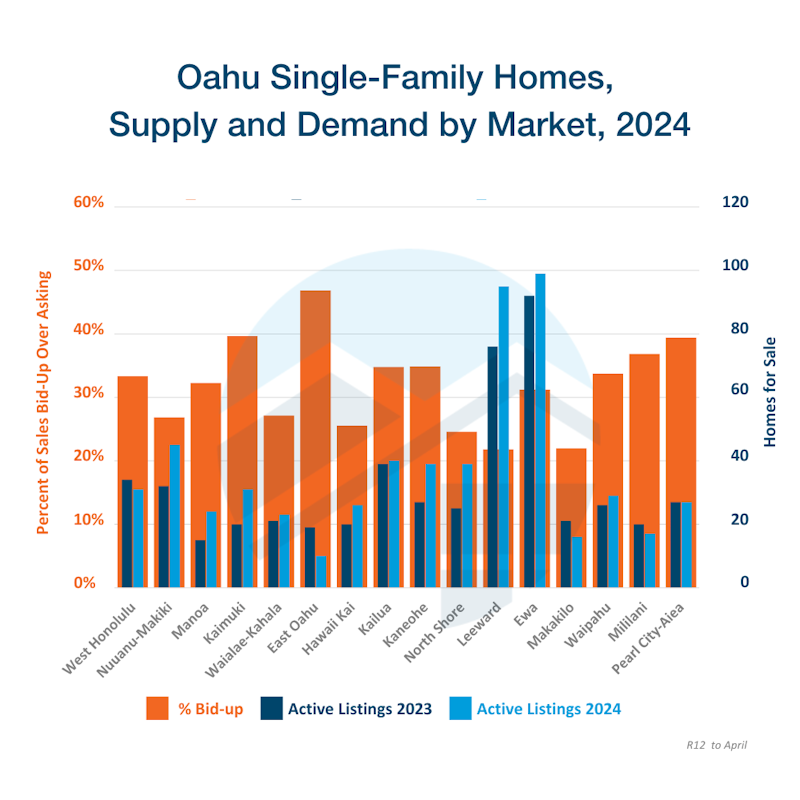
5. Putting these metrics together, we can see the effects of supply and demand on the local-market level. Demand, as measured by the percentage of bid-ups, is highest in the East Oahu market, where listings are also the lowest. (A "bid-up" is when a home is sold for above the asking price in a competitive bidding situation). On the other hand, although Ewa has the most listings year-to-date, about one in three homes are bid-up over asking, similar to the island-wide rate. Demand is weakest in the Leeward and Makakilo markets, with about one in five homes bid-up over asking, even though the housing supply is much higher in Leeward than Makakilo. The differences in supply and demand can mean different strategies for buyers and for sellers in each market. Your Realtor can advise you on the best homebuying or selling strategies for your situation and neighborhood.
As these charts illustrate, each neighborhood and local market area has its own unique set of market dynamics. Whether you're buying, selling or just curious about your home's value, a Locations agent can provide you with the most accurate, up-to-date market analysis, tailored to your neighborhood (or condo building) of choice.


Congratulations, you have access to Hawaii's most comprehensive Real Estate Search! Please help us to better serve you by answering these optional questions.
Facebook Registration
This email is already registered. Click the button below and we'll send you a link to reset your password.
You have already registered using your FB account.
Check your inbox for an email from brokersmls@locationshawaii.com. It contains a link to reset your password.
The agent who gave you access to this website is no longer with Locations LLC.
Due to local MLS regulations, you will need to re-register if you would like to continue your access.
We will pre-fill the registration form with information in our files. Once you click Register you can either select a new agent or one will be assigned for you.
Sorry for the inconvenience, Locations LLC.
Schedule a Virtual Tour
Request an appointment to view this property by completing the information below. Please note your appointment is not confirmed until an agent calls you.
Disclaimer: The properties we may show you may be Locations LLC listings or listings of other brokerage firms. Professional protocol requires agent to set up an appointment with the listings agent to show a property. Locations, LLC may only show properties marked "Active" and "ACS".
Listings in
Additional Criteria
Keep your eye on this property! Save this listing and receive e-mail updates if the status of the property changes.
Share this property by completing the the form below. Your friend will receive an e-mail from you with a link to view the details of this property.
How can we help?
Send a message and we'll respond shortly.
We will not rent, share, or sell your information. Privacy Policy.
