


What Happened in the Oahu Real Estate Market in November 2023?
“Mortgage rates have improved over the past several weeks, and we expect to see rates drop below 7% in 2024, hopefully offering prospective buyers some much-needed relief,” said Chief Operating Officer for Locations Chad Takesue. “We’ll continue to monitor the effect of mortgage rates on the Oahu residential real estate market.”
By market area, single-family home prices have decreased by 10 percent on the North Shore and five-to-nine percent in town. Home prices have increased in Kailua and Makakilo, and remained flat in Mililani.
Median condo prices have increased by five percent in East Oahu from Diamond Head to Hawaii Kai, as well as in Leeward Coast. Condo prices have remained flat in town, with the exception of a seven percent decrease in Ala Moana-Kakaako.
“As we look ahead to 2024, we anticipate stronger sales activity as mortgage rates cool,” said Takesue. “We could see a modest increase in inventory if lower rates bring more sellers to the market. As rates come down, we’d except to see home prices rise.”
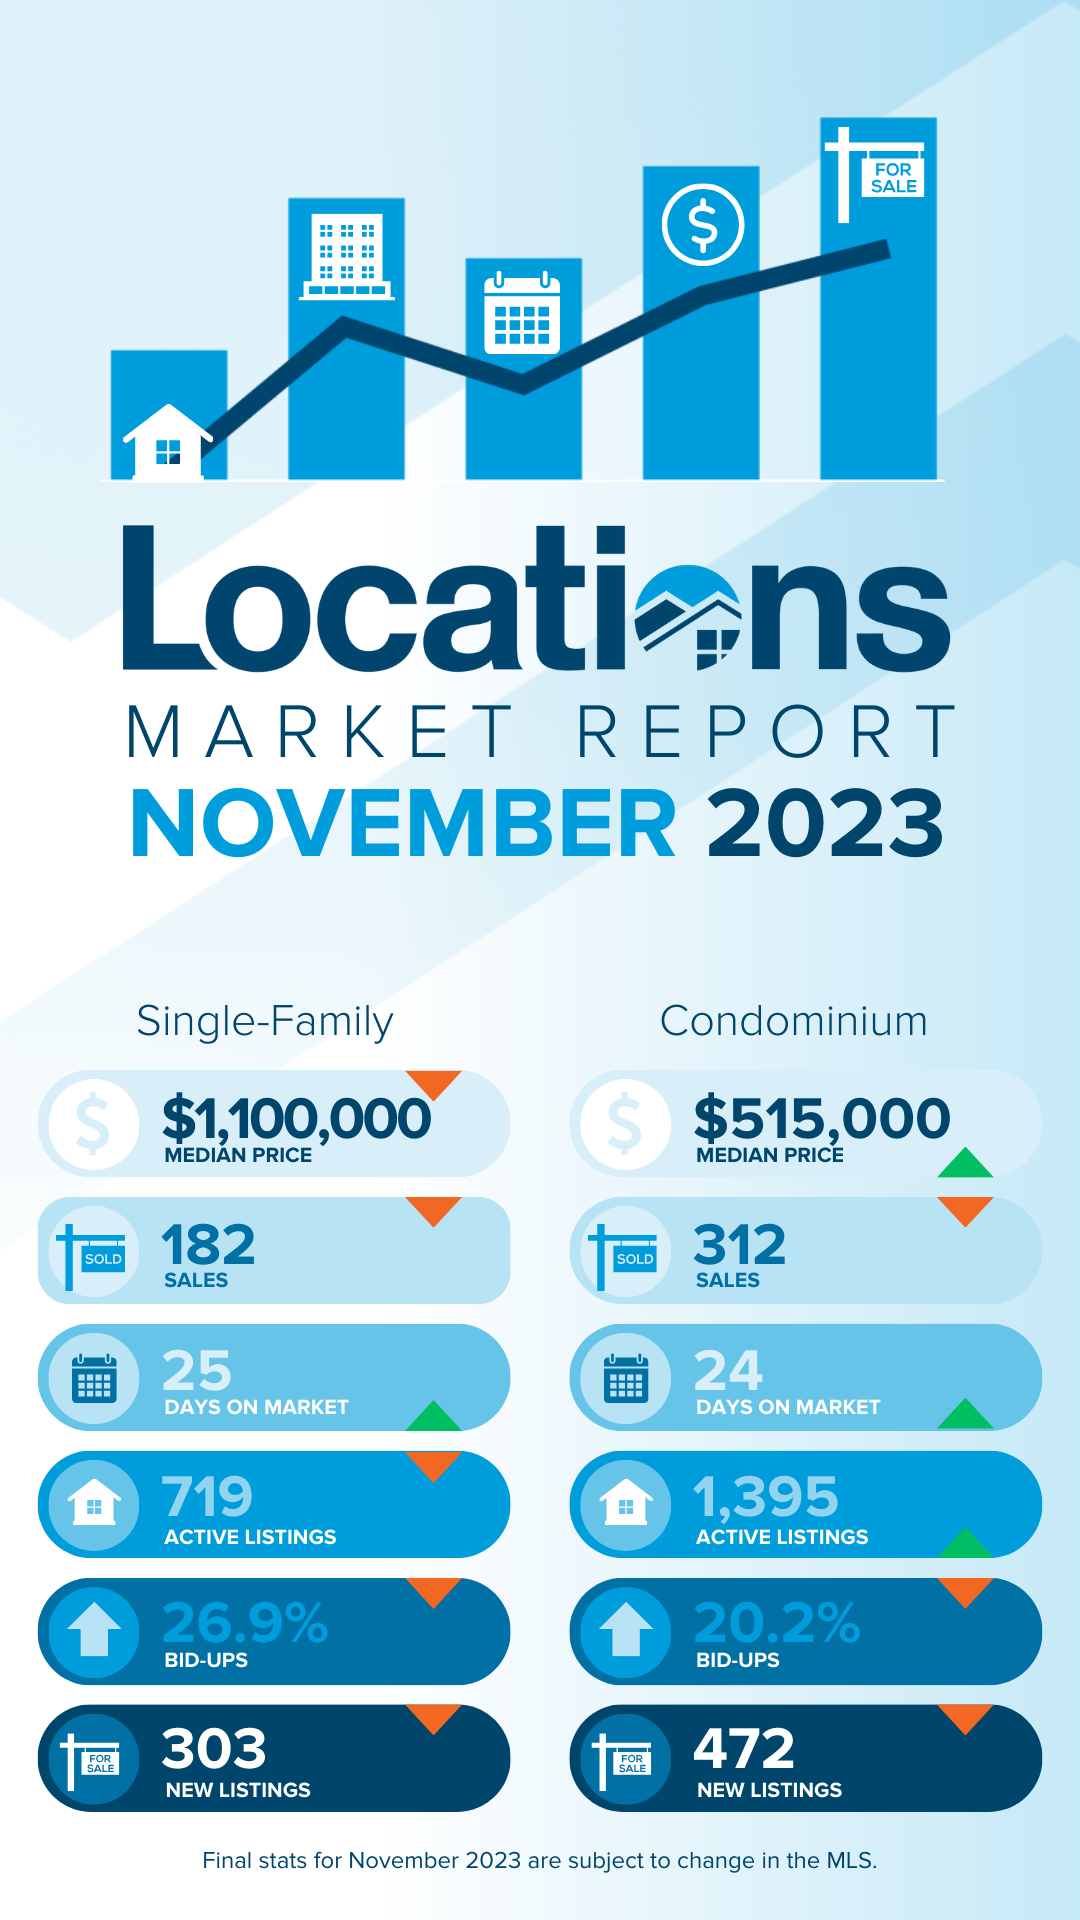
Key Takeaways from the November 2023 Locations Oahu Real Estate Report
New to real estate market data terms? See our glossary.
- At $1,100,000, the Oahu single-family median home price was four percent below the previous year in November 2023, while the median condo price was seven percent higher than a year ago at $515,000. Home prices have increased by six percent since the beginning of 2023.
- Sales were down by nine percent in November for both single-family homes and condos. Sales trends are settling into typical seasonal patterns and will end the year 28% lower than 2022.
- 719 homes and 1,395 condos were available for sale at the end of November—two percent fewer homes and seven percent more condos than a year ago. Inventory has been rising slightly in the last half of 2023 but is still at historically low levels.
- Months of Remaining Inventory (MRI) is up slightly at 3.3 months for homes and 3.6 months for condos. This measure of supply and demand has been moving upward due to lower sales in 2023 and rising inventory in the past two months; however, MRI is still firmly in sellers’ market territory.
- Single-family homes were on the market for a median of 25 days in November, while condos were on the market for a median of 24 days. Although his measure has been rising toward year’s end, in line with typical seasonal trends, continued demand keeps market times relatively low.
- Competition among buyers continued in November, with more than one in four homes and one in five condos sold for above the asking price in competitive bidding.
What Happened in Oahu Single-Family Home Markets in November 2023?
Market statistics can vary greatly by neighborhood, so it's important to consult a knowledgeable Realtor who has access to market-level data.
Here's a detailed breakdown of key Oahu single-family home market areas:
West Honolulu Homes
West Honolulu home sales decreased by 34% compared to the previous year. The median price also fell by 7%, settling at $1,055,000. Days on Market (DOM) increased by 31%, reaching a median of 17 days, while bid-ups fell to 28.1%, down 43% from the previous year. Months of Remaining Inventory (MRI) increased by 36%, reaching 3.6 months. Active listings fell by 10% to 36 at the end of November 2023.
Nuuanu-Makiki Homes
In Nuuanu-Makiki, home sales fell by 34% compared to the previous year, with 95 homes sold. The median price decreased by 9% to $1,182,000. Days on Market (DOM) increased by 50% to a median of 21 days, while bid-ups dropped by 26%, settling at 30.5%. Months of Remaining Inventory (MRI) increased by 80% to 5.8 months, indicating a shift toward a more balanced market. Active listings increased by 18%, to 46 homes.
Manoa Homes
The Manoa home market saw a decline in sales, with 71 homes sold—a 24 decrease from the previous year. Additionally, the median price dropped by 5% to $1,521,400. Days on Market (DOM) increased by 15%, reaching a median of 15 days, while bid-ups dropped by 44%, settling at 32.4%. Months of Remaining Inventory (MRI) increased by 108% to 3.7 months. Lastly, there was an increase in active listings, rising by 57% to a total of 22 homes.
Kaimuki Homes
Kaimuki home sales dropped by 43% compared to the previous year, with 107 homes sold. The median price fell by 4% to $1,200,000. Days on Market (DOM) was flat compared to 2022, with homes taking a median of 14 days to sell. Bid-ups decreased by 13%, settling at 40.2%, while Months of Remaining Inventory (MRI) climbed by 81% to 3.8 months. Additionally, active listings ticked up by 3% to a total of 34 homes.
Waialae-Kahala Homes
The Waialae-Kahala home market experienced a 27% decrease in sales, with 71 homes sold. The median price fell by 6%, settling at $2,457,000. Days on Market (DOM) doubled from the previous year, reaching a median of 30 days. Bid-ups decreased by 46% to 23.9%. Months of Remaining Inventory (MRI) increased by 25% to 5.2 months. Active listings decreased by 9% to 31 homes.
East Oahu Homes
East Oahu home sales dropped 32%, with 67 homes sold, while the median price increased by 7% to $1,670,000. Days on Market (DOM) were flat compared to the previous Novemebr, at a median of 14 days. Bid-ups saw a slight 1% decrease, settling at 44.8%. Months of Remaining Inventory (MRI) increased by 65% to 5 months. Active listings increased by 12% to 28 homes.
Hawaii Kai Homes
The Hawaii Kai home market had a 30% decrease in sales, with 132 homes sold, and a 6% decrease in the median price, which settled at $1,505,000. Days on Market (DOM) increased by 12% to a median of 15 days, and bid-ups dropped by 42%, settling at 31.8%. Months of Remaining Inventory (MRI) surged by 53% to 2.7 months. Active listings increased by 7% to 30 homes.
Kailua Homes
Kailua home sales decreased by 24%, with 243 homes sold, and a slight 2% increase in the median price, reaching $1,635,000. Days on Market (DOM) increased by 33% to a median of 16 days, while bid-ups decreased by 39% to 30.9%. Months of Remaining Inventory (MRI) increased by 19% to 2.3 months. Active listings fell by 10% to 46 homes.
Kaneohe Homes
The Kaneohe home market saw a 19% decrease in sales, with 179 homes sold. The median price slipped by 2% from the previous year to $1,190,000. Days on Market (DOM) increased by 17% to a median of 14 days, while bid-ups decreased by 37% to 36.3%. Months of Remaining Inventory (MRI) increased by 21% to 2.4 months. Active listings were 3% lower than a year ago at 36 homes.
North Shore Homes
North Shore home sales fell by 38%, with 63 homes sold. The median price decreased by 10% to $1,580,000. Days on Market (DOM) increased by 45% to a median of 29 days, while bid-ups decreased by 22%, settling at 23.8%. Months of Remaining Inventory (MRI) increased by 21% to 5.3 months, suggesting a more balanced market. Active listings decreased by 24% to 28 homes.
Leeward Homes
Leeward home sales slipped by 13% compared to the previous year, with 251 homes sold, and a 4% decrease in the median price, which landed at $680,000. Days on Market (DOM) increased by 138%, with homes taking a median of 38 days to sell. Bid-ups also dropped by 39%, settling at 27.9%. Months of Remaining Inventory (MRI) increased by 21% to 4.8 months, suggesting a more balanced market. Active listings rose by 5% to 100 homes.
Ewa Homes
Home sales in Ewa dropped by 33%, with 484 homes sold, and a 4% decrease in the median price to $885,000. Days on Market (DOM) increased by 191%, with homes taking a median of 32 days to sell. Bid-ups fell by 48%, settling at 30.2%. Months of Remaining Inventory (MRI) increased by 25% to 2.7 months. Active listings decreased by 16% to 108 homes.
Makakilo Homes
Makakilo home sales decreased by 42%, with 91 homes sold. The median price increased by a slight 4%, reaching $1,025,000. Days on Market (DOM) doubled, with homes on the market for a median of 24 days. Bid-ups fell by 47%, settling at 28.6%, while Months Remaining Inventory (MRI) increased by 59% to 3.2 months. Active listings decreased by 8% to 24 homes.
Waipahu Homes
In Waipahu, home sales decreased by 32%, with 160 homes sold. The median price fell by 4% to $912,500. Days on Market (DOM) increased by 92%, reaching a median of 23 days, while bid-ups dropped by 47%, settling at 31.9%. Months of Remaining Inventory (MRI) increased by 29% to 2.3 months. Active listings decreased by 12% to 30 homes.
Mililani Homes
The Mililani homes market saw a 35% decrease in sales, with 129 homes sold. The median price remained relatively stable at $1,075,000, with no significant change from the previous year. Days on Market (DOM) increased by 55%, reaching a median of 17 days, while bid-ups dropped by 43%, settling at 33.3%. Months of Remaining Inventory (MRI) increased by 19% to 1.6 months. Active listings decreased by 23% to 17 homes.
Pearl City-Aiea Homes
Pearl City-Aiea home sales decresed by 19%, with 186 homes sold. The median price decreased by 7% to $982,500. Days on Market (DOM) increased by 55% to a median of 17 days, while bid-ups dropped by 40%, settling at 38.7%. Months of Remaining Inventory (MRI) increased by 27% to 2 months. Active listings rose by 3% to 31 homes.
What Happened in Oahu Condo Markets in November 2023?
Here's a detailed breakdown of key Oahu condo market areas:
Salt Lake Condos
The Salt Lake condo market experienced a 41% decrease in sales, with 151 condos sold. At $445,000, there was no change in the median price from the previous year. Days on Market (DOM) decreased by 13%, settling at a median of 13 days. However, bid-ups decreased by 35% to 23.2% of condos bid up over asking. Months of Remaining Inventory (MRI) increased significantly by 159%, reaching 2.5 months, while the number of active listings rose by 52% to 32 condos.
Downtown-Nuuanu Condos
Sales of Downtown-Nuuanu condos dropped by 38%, with 258 condos sold. The median price decreased by 59%, settling at $403,500, and Days on Market increased by 67% to a median of 25 days. Bid-ups also decreased by 59% to 14.7% of condos bid up over asking, while Months of Remaining Inventory increased by 42% to 2.8 months. Active listings decreased by 12% to 61 condos.
Ala Moana-Kakaako Condos
The Ala Moana-Kakaako condo market saw 29% fewer sales, with 679 condos sold, and a 7% drop in median price to $722,000. Days on Market increased by 31%, reaching a median of 32 days. Bid-ups also decreased by 40% to 11% of condos bid up over asking, indicating slightly reduced competition. Months of Remaining Inventory increased by 37% to 5.8 months, while active listings decreased by 3% to 330 condos.
Makiki Condos
Makiki condo sales decreased by 32%, with 289 units sold. The median price was flat compared to last year at $390,000. Days on Market increased by 27% to a median of 19 days, while bid-ups decreased by 38% to 20.8% of condos bid up over asking. Months of Remaining Inventory increased by 93%, reaching 3.7 months. Active listings increased by 32% to 90 condos.
Waikiki Condos
Sales of Waikiki condos fell by 18%, with 1,089 condos sold. The median price increased by 1% to $428,000. Days on Market increased by 30%, reaching a median of 26 days. Bid-ups decreased by 27% to 16.9% of condos bid up over asking, while Months of Remaining Inventory increased by 19%, reaching 4.6 months. Active listings slipped by 2% to 419 condos.
Kapiolani-University Condos
Kapiolani-University condo sales decreased by 36%, with 237 condos sold, while the median price fell by 2% to $410,000. Days on Market increased by 13%, reaching a median of 17 days. Bid-ups decreased by 29% to 20.7% of condos bid up over asking, while Months of Remaining Inventory increased by 103%, reaching 3.7 months. Active listings increased by 30% to 73 condos.
Diamond Head-Kahala Condos
The Diamond Head-Kahala condo market experienced a 35% decrease in sales, with 94 condos sold, and an 8% increase in median price, reaching $677,500. Days on Market increased by 3%, settling at a median of 15 days. Bid-ups dropped by 40% to 17% of condos bid up over asking. Months of Remaining Inventory rose by 90% to 3.3 months, while active listings increased by 24% to 26 condos.
Hawaii Kai Condos
Sales of Hawaii Kai condos decreased by 32%, with 142 condos sold, and the median price increased by 3% to $849,500. Days on Market increased by 79% to a median of 22 days. Bid-ups decreased by 53% to 22.5% of condos bid up over asking. Months of Remaining Inventory dipped by 10%, hitting 1.9 months. Active listings decreased by 39% to 22 condos.
Kailua Condos
Kailua condo sales only decreased by 3%, with 102 condos sold. The median price also remained relatively stable, with just a 1% decrease to $747,500. Days on Market increased by 70% to a median of 17 days. Bid-ups decreased by 53% to 27.5% of condos bid up over asking. Months of Remaining Inventory increased by 62%, reaching 2.6 months. Active listings grew by 57% to 22 condos.
Kaneohe Condos
Sales of Kaneohe condos decreased by 33%, with 139 units sold, while the median price decreased by 5% to $675,000. Days on Market increased by by 70%, settling at a median of 17 days. Bid-ups dropped by 40% to 36% of condos bid up over asking, as Months of Remaining Inventory grew by 89% to 2.5 months. Active listings rose by 26% to 29 condos.
Leeward Condos
The Leeward condo market experienced a 33% decrease in sales, with 160 condos sold, and a 5% increase in the median price to $255,000. Days on Market increased significantly by 129% to a median of 28 days. Bid-ups decreased by 32% to 26.3% of condos bid up over asking. Months of Remaining Inventory also increased signicantly, rising by 128% to 4.1 months. Active listings increased by 53% to 55 condos.
Ewa Condos
Sales of Ewa condos decreased by 35%, with 400 units sold. The median price decreased by 2%, reaching $675,000. At a median of 18 days, Days on Market increased by 75%. Bid-ups dropped by 47% to 33.8% of condos bid up over asking. Months of Remaining Inventory increased by 42%, reaching 2 months. Active listings decreased by 7% to 65 condos.
Makakilo Condos
Condo sales in Makakilo decreased by 26%, with 116 condos sold, while the median price remained stable at $550,000, a 1% dip. Days on Market rose by 90%, reaching a median of 19 days, while bid-ups dropped by 36% to 44.8% of condos bid up over asking. Months of Remaining Inventory increased by 50% to 2.2 months. Active listings increased by 11% to 21 condos.
Waipahu Condos
With 148 units sold, Waipahu condo sales slipped by 32%, as the median price dipped by 2% to $500,000. At a median of 17 days, Days on Market increased by 70%. Bid-ups fell by 38% to 37.8% of condos bid up over asking. and Months of Remaining Inventory increased by 29% to 1.2 months. Active listings decreased by 12% to 15 condos.
Mililani Condos
Mililani condo sales decreased by 24%, with 300 units sold, as the median price decreased by 2% to $515,000. Days on Market climbed by 40%, reaching a median of 14 days. Bid-ups decreased by 37% to 42.3% of condos bid up over asking. Months of Remaining Inventory increased by 39%, reaching 1.4 months. Active listings increased by 6% to 36 condos.
Pearl City-Aiea Condos
The Pearl City-Aiea condo market experienced a 37% decrease in sales, with 251 condos sold, and a 1% increase in median price to $470,000. At a median of 14 days, Days on Market increased by 40%. Bid-ups decreased by 27% to 36.7% of condos bid up over asking. With a significant increase of 193%, Months of Remaining Inventory reached 2.5 months. Active listings increased by 86% to 52 condos.
Summary
Because real estate market conditions can vary greatly among Oahu market areas, it's important for buyers and sellers to partner with a Realtor who has access to detailed, neighborhood-level data.
Glossary
- Active Listings: Count of MLS listings with "Active" status on the last day of the period.
- Bid-Up %: The percent of sales that were bid-up over asking price in competitive offers.
- Days on Market (DOM): Median number of days between listing date and escrow date, for all properties sold in the period.
- Months of Remaining Inventory (MRI): The number of months it would take to sell out the current active inventory at the recent rate of sales. A balance point between supply and demand is considered to be around 6 months, so MRI below 6 months indicates more of a sellers market and MRI above 6 months indicates more of a buyers market.


Congratulations, you have access to Hawaii's most comprehensive Real Estate Search! Please help us to better serve you by answering these optional questions.
Facebook Registration
This email is already registered. Click the button below and we'll send you a link to reset your password.
You have already registered using your FB account.
Check your inbox for an email from brokersmls@locationshawaii.com. It contains a link to reset your password.
The agent who gave you access to this website is no longer with Locations LLC.
Due to local MLS regulations, you will need to re-register if you would like to continue your access.
We will pre-fill the registration form with information in our files. Once you click Register you can either select a new agent or one will be assigned for you.
Sorry for the inconvenience, Locations LLC.
Schedule a Virtual Tour
Request an appointment to view this property by completing the information below. Please note your appointment is not confirmed until an agent calls you.
Disclaimer: The properties we may show you may be Locations LLC listings or listings of other brokerage firms. Professional protocol requires agent to set up an appointment with the listings agent to show a property. Locations, LLC may only show properties marked "Active" and "ACS".
Listings in
Additional Criteria
Keep your eye on this property! Save this listing and receive e-mail updates if the status of the property changes.
Share this property by completing the the form below. Your friend will receive an e-mail from you with a link to view the details of this property.
How can we help?
Send a message and we'll respond shortly.
We will not rent, share, or sell your information. Privacy Policy.
