


What Happened in the Oahu Real Estate Market in June 2024?
Monthly median prices showed gains in June, hitting their highest points thus far in 2024. Home and Condo prices continue to show increasing trends in 2024, indicating ongoing overall demand. We expect to see steady sales and flat to slightly increasing prices for the general market through the end of 2024 and into 2025, driven by this sustained demand for Oahu homes and condos.
“The Oahu real estate market continues to follow typical seasonal trends, with our two markets diverging—homes remain stable and strengthen slightly, while the condo market softens,” said Chief Sales Officer for Locations Chad Takesue. “Inventory for sale and the supply-demand balance of remaining inventory are significant differences between the home and condo markets," he added.
June was a weak month for the condo market. Sales were down 24 percent from last year, and inventory is up almost 50 percent from last year, rising six percent within the month. Days on Market increased in June, reversing from the seasonal downward trend. Condo bid-ups remained under 20 percent, missing the typical summer rise. However, condo prices slightly increased from last year, despite multiple signs of softening conditions.
Inventory increases are generally positive for the Oahu real estate market, helping ease what have been very competitive conditions in the past few years. For condos, the largest numbers of listings are in Waikiki and Ala Moana-Kakaako, but they have also had the smallest growth in inventory. The highest inventory growth markets are Mililani, Kailua/Kaneohe, and Pearl City-Aiea. Hawaii Kai condos show the lowest growth in inventory, and also the lowest Months Remaining Inventory (MRI), indicating very strong demand conditions there.
For homes, the Ewa market has the most listings, but it’s seen the lowest growth, a 17 percent decrease in available properties. All West Oahu markets have seen decreases in inventory in the past year. The highest inventory growth markets for homes are Kaimuki, Kaneohe, and North Shore. North Shore had the largest swing in supply-demand balance, and with 10.5 months of remaining inventory, it is now showing buyers' market conditions.
New to real estate market data terms? See our glossary.
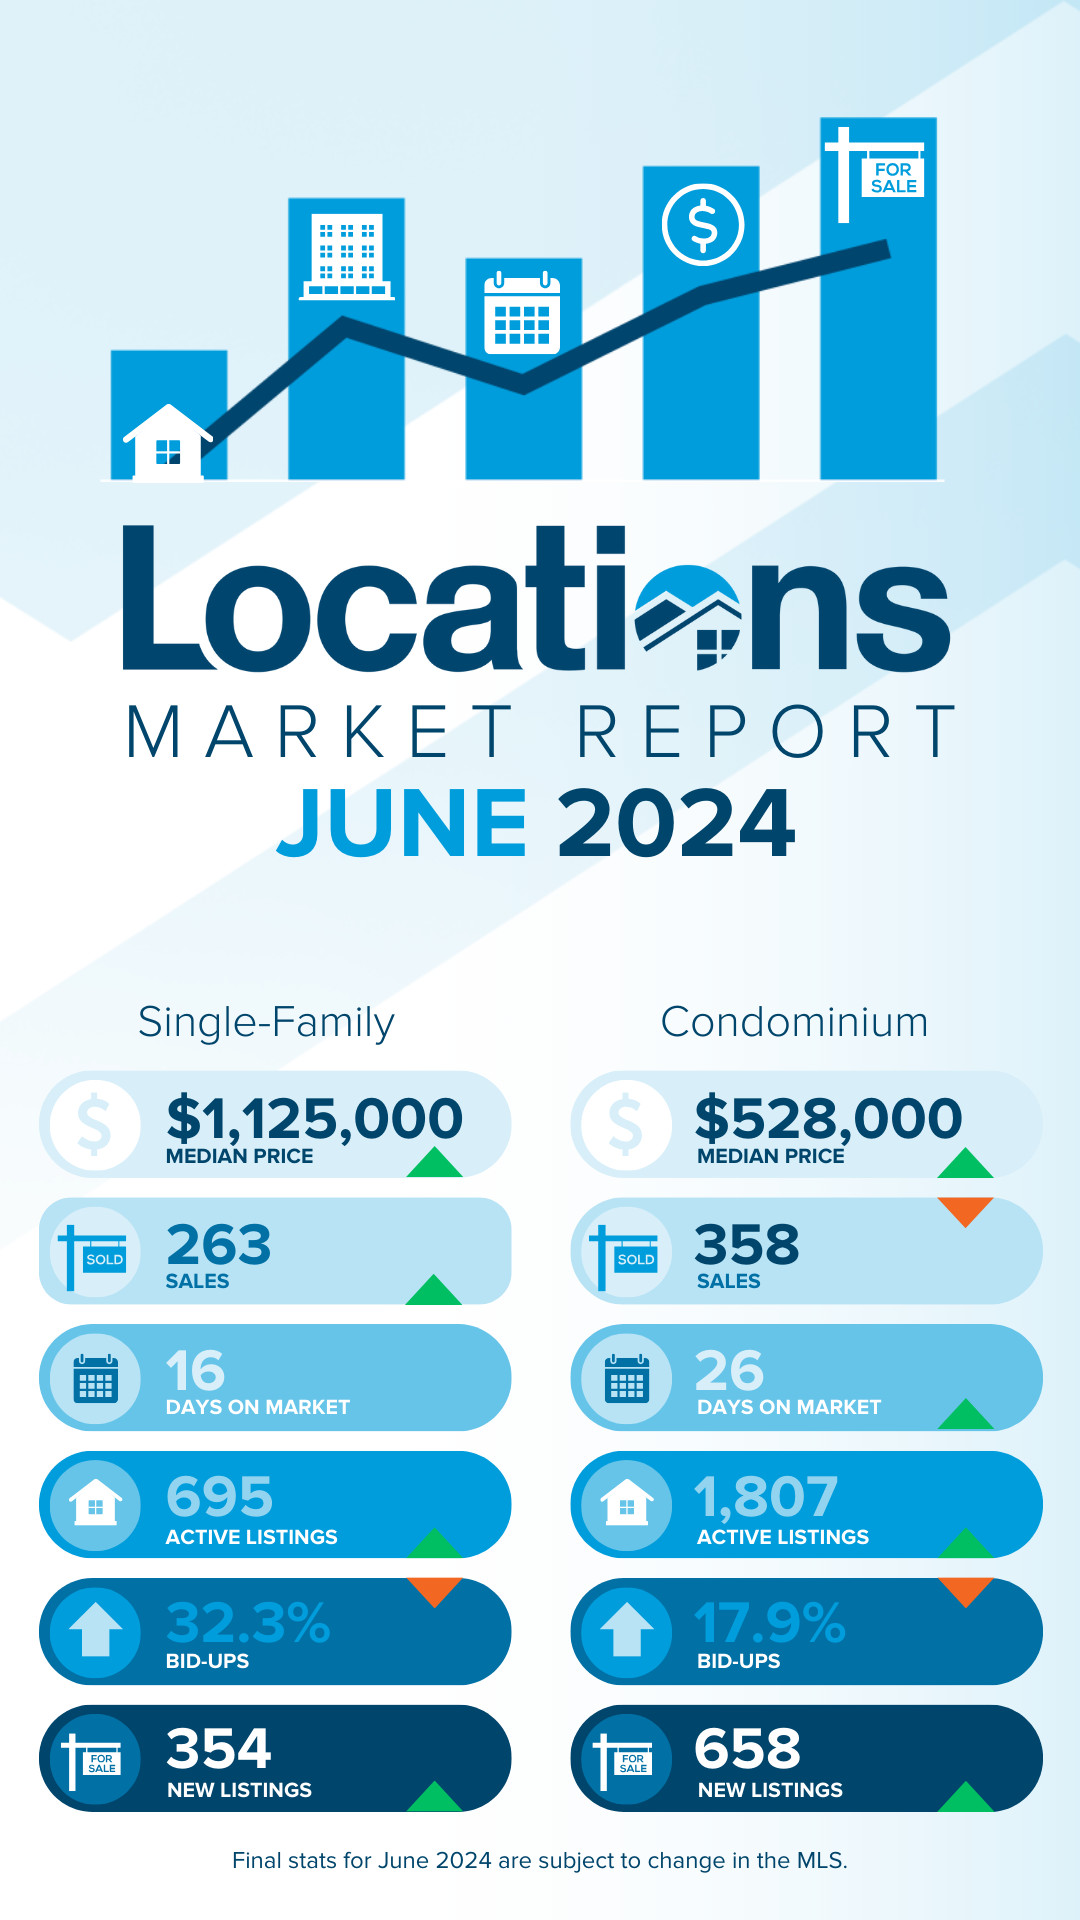
- Monthly median prices showed gains in June, hitting high points in 2024. The home median price of $1,125,000 and the condo median price of $528,000 are up seven percent and four percent, respectively, from last year and are both the highest this year. Monthly median prices continue to trend slightly higher in 2024.
- June 2024 sales are up four percent for homes and down 24 percent for condos from June last year. Year-to-date, home sales are up six percent and condo sales are down six percent from last year, with both sectors largely following the seasonal trend.
- At the end of June 2024, 695 single-family homes and 1,807 condos were available for sale -- an increase of nine percent for homes and 49 percent for condos from this time last year. Condo inventory is increasing, indicating a softening of demand in that market segment.
- There were 3.1 Months of Remaining Inventory (MRI) for single-family homes and 4.8 MRI for condos at the end of June 2024. Months of Remaining Inventory has shown some increase, but is still in sellers' market territory, with the increasing supply continuing to be met by strong demand.
- Days on Market (DOM) is shortening into the spring and summer, following typical seasonal trends, with the condo market showing signs of softening. The median DOM in June was 16 days for homes and 26 days for condos.
- In June 2024, 32.3 percent of homes sold and 17.9 percent of condos sold were bid up over the asking price, about one in every three homes sold and one in every five condos sold. The condo market is showing signs of easing demand.
What Happened in Oahu Single-Family Home Markets in June 2024?
Market statistics can vary greatly by neighborhood, so it's important to consult a knowledgeable Realtor who has access to market-level data.
Here's a detailed breakdown of key Oahu single-family home market areas, looking at the past 12 months:
West Honolulu Homes
Sales in West Honolulu declined by 18% to 118 homes, while the median price increased by 8% to $1,057,500. Homes spent 18% more time on the market, averaging 17 days. The bid-up percentage decreased by 10% to 31.4%. MRI rose by 46% to 3.7 months, with a 20% increase in active listings to 36.
Nuuanu-Makiki Homes
The Nuuanu-Makiki area saw a 28% increase in sales to 114 homes, with a 4% rise in the median price to $1,200,000. Homes took 28% longer to sell, averaging 23 days. The bid-up percentage dropped by 10% to 26.3%. MRI decreased by 14% to 4.5 months, with a 10% increase in active listings to 43.
Manoa Homes
Manoa experienced a 19% decrease in sales to 64 homes, as the median price rose by 6% to $1,597,500. Homes were on the market for 42% longer, averaging 17 days. The bid-up percentage fell by 28% to 32.8%. MRI increased by 65% to 3.8 months, with a 33% increase in active listings to 20.
Kaimuki Homes
Sales in Kaimuki dropped by 16% to 120 homes, while the median price increased by 2% to $1,250,000. Homes took 13% less time to sell, averaging 13 days. The bid-up percentage decreased by 4% to 35.0%. MRI more than doubled to 3.4 months, with a 79% increase in active listings to 34.
Waialae-Kahala Homes
Sales in Waialae-Kahala fell by 17% to 67 homes, and the median price decreased by 4% to $2,400,000. Homes spent 44% more time on the market, averaging 26 days. The bid-up percentage decreased by 21% to 28.4%. MRI increased slightly by 3% to 4.1 months, with a 15% decrease in active listings to 23.
East Oahu Homes
East Oahu saw a 19% decline in sales to 66 homes, with a 3% decrease in the median price to $1,750,000. Homes took 11% less time to sell, averaging 16 days. The bid-up percentage increased by 10% to 39.4%. MRI rose by 39% to 4.7 months, with a 13% increase in active listings to 26.
Hawaii Kai Homes
Sales in Hawaii Kai increased by 4% to 135 homes, while the median price decreased by 2% to $1,575,000. Homes took 16% longer to sell, averaging 18 days. The bid-up percentage dropped by 11% to 28.9%. MRI rose by 19% to 2.3 months, with a 24% increase in active listings to 26.
Kailua Homes
Sales in Kailua fell by 7% to 239 homes, while the median price increased by 6% to $1,700,000. Homes took 29% less time to sell, averaging 12 days. The bid-up percentage increased by 27% to 37.7%. MRI rose by 24% to 2.3 months, with a 15% increase in active listings to 46.
Kaneohe Homes
Sales in Kaneohe increased by 8% to 198 homes, with a 1% rise in the median price to $1,200,000. Homes took 29% less time to sell, averaging 12 days. The bid-up percentage dropped by 15% to 34.3%. MRI increased by 64% to 2.7 months, with a 76% increase in active listings to 44.
North Shore Homes
Sales North Shore fell by 25% to 56 homes, and the median price decreased by 11% to $1,428,150. Homes took 40% less time to sell, averaging 24 days. The bid-up percentage increased slightly by 2% to 23.2%. MRI more than doubled to 10.5 months, with a 58% increase in active listings to 49.
Leeward Homes
Leeward's housing market witnessed a 1% increase in sales to 246 homes, with a slight 1% decrease in the median price to $675,000. Homes took 25% longer to sell, averaging 35 days. The bid-up percentage decreased by 29% to 22.4%. MRI rose by 16% to 4.3 months, with a 17% increase in active listings to 88.
Ewa Homes
Sales in Ewa decreased by 8% to 483 homes, and the median price fell by 2% to $880,000. Homes took 8% longer to sell, averaging 27 days. The bid-up percentage decreased by 6% to 30.2%. MRI fell by 10% to 2.8 months, with a 17% decrease in active listings to 111.
Makakilo Homes
In Makakilo, there was a a 23% drop in sales to 81 homes, while the median price increased by 3% to $999,999. Homes took 44% longer to sell, averaging 26 days. The bid-up percentage dropped significantly by 52% to 16.0%. MRI rose by 16% to 2.5 months, with an 11% decrease in active listings to 17.
Waipahu Homes
Sales in Waipahu decreased by 4% to 161 homes, with a 1% increase in the median price to $950,000. Homes took 27% longer to sell, averaging 21 days. The bid-up percentage increased by 20% to 37.9%. MRI decreased by 14% to 1.8 months, with a 17% decrease in active listings to 24.
Mililani Homes
Mililani saw an 11% decrease in sales to 131 homes, with the median price remaining stable at $1,075,000. Homes took 16% less time to sell, averaging 16 days. The bid-up percentage remained stable at 35.9%. MRI decreased slightly to 1.3 months, with a 13% decrease in active listings to 14.
Pearl City-Aiea Homes
The Pearl City-Aiea area saw an increase in sales by 4% to 211 homes, with a 6% rise in the median price to $1,040,999. Homes took 14% longer to sell, averaging 16 days. The bid-up percentage decreased by 13% to 39.8%. MRI decreased slightly by 4% to 1.4 months, with active listings remaining stable at 25.
What Happened in Oahu Condo Markets in June 2024?
Here's a detailed breakdown of key Oahu condo market areas, looking at the past 12 months:
Salt Lake Condos
Salt Lake condo sales dropped by 8% to 153, with the median price remaining stable at $435,000. Condos took 62% longer to sell, averaging 21 days. The bid-up percentage increased slightly by 6% to 24.8%. MRI almost doubled to 3.8 months, with a 78% increase in active listings to 48.
Downtown-Nuuanu Condos
The Downtown-Nuuanu condo market witnessed a decline in sales by 13% to 253, with a 4% rise in the median price to $409,000. Condos took 18% longer to sell, averaging 26 days. The bid-up percentage dropped by 21% to 14.6%. MRI increased by 73% to 4.3 months, with a 50% increase in active listings to 90.
Ala Moana-Kakaako Condos
Ala Moana-Kakaako experienced a 10% decrease in sales to 642, with a slight 1% decrease in the median price to $754,500. Condos took 25% longer to sell, averaging 38 days. The bid-up percentage fell by 26% to 9.2%. MRI rose by 55% to 7.5 months, with a 39% increase in active listings to 401.
Makiki Condos
In Makiki, condo sales decreased by 5% to 276, with the median price remaining stable at $393,500. Condos took 47% longer to sell, averaging 27 days. The bid-up percentage dropped by 31% to 16.3%. MRI rose by 70% to 4.9 months, with a 61% increase in active listings to 113.
Waikiki Condos
Waikiki witnessed a 7% decrease in condos sales, with 1,041 condos sold. Despite this, the median price increased 6% to $435,000. Condos took 30% longer to sell, averaging 30 days. The bid-up percentage fell by 38% to 13.1%. MRI increased by 33% to 5.8 months, with a 23% increase in active listings to 505.
Kapiolani-University Condos
Sales in Kapiolani-University decreased by 11% to 237, with a 2% decrease in the median price to $410,000. Condos took the same amount of time to sell as last year, averaging 18 days. The bid-up percentage decreased by 16% to 19.8%. MRI surged by 99% to 4.7 months, with a 77% increase in active listings to 92.
Diamond Head-Kahala Condos
Diamond Head-Kahala saw a 2% decrease in condo sales, with 96 condos sold. However, the median price increased 5% increase to $662,000. Condos took 27% less time to sell, averaging 16 days. The bid-up percentage slightly increased by 2% to 16.7%. MRI more than doubled to 6.5 months, with active listings doubling to 52.
Hawaii Kai Condos
Hawaii Kai condo sales decreased by 15% to 133, with a slight 2% decrease in the median price to $810,000. Condos took 21% less time to sell, averaging 15 days. The bid-up percentage increased by 7% to 28.6%. MRI rose by 18% to 1.9 months, with active listings remaining stable at 21.
Kailua Condos
Condo sales in Kailua decreased by 14% to 89, with a 5% increase in the median price to $775,000. Condos took 13% longer to sell, averaging 18 days. The bid-up percentage fell by 44% to 19.1%. MRI more than doubled to 2.8 months, with active listings almost doubling to 21.
Kaneohe Condos
In Kaneohe, condo sales decreased by 13% to 140, with a 6% increase in the median price to $720,000. Condos took 7% less time to sell, averaging 13 days. The bid-up percentage decreased by 13% to 33.6%. MRI more than doubled to 3.2 months, with active listings more than doubling to 37.
Leeward Condos
Leeward condo condo sales fell by 16% to 144, with a slight 4% decrease in the median price to $247,500. Condos took 82% longer to sell, averaging 35 days. The bid-up percentage decreased by 16% to 21.5%. MRI rose by 76% to 6.3 months, with a 47% increase in active listings to 75.
Ewa Condos
Sales of Ewa condos decreased by 20% to 354, with a 4% rise in the median price to $684,500. Condos took 33% longer to sell, averaging 20 days. The bid-up percentage decreased by 15% to 31.6%. MRI more than doubled to 3.5 months, with a 65% increase in active listings to 104.
Makakilo Condos
Makakilo witnessed a notable decrease in condo sales by 24%, with the median price remaining stable at $552,000. Condos took 29% longer to sell, averaging 20 days. The bid-up percentage dropped significantly by 34% to 36.1%. MRI surged by 151% to 2.4 months, with active listings almost doubling to 19.
Waipahu Condos
Waipahu condo sales decreased by 10% to 147, with a slight 2% decrease in the median price to $500,000. Condos took 29% longer to sell, averaging 18 days. The bid-up percentage fell by 38% to 29.3%. MRI rose by 43% to 2.2 months, with a 29% increase in active listings to 27.
Mililani Condos
In Mililani, condo sales decreased by 16% to 274 condos, with a slight 2% decrease in the median price to $515,000. Condos took 38% longer to sell, averaging 18 days. The bid-up percentage decreased by 10% to 42.0%. MRI more than doubled to 2.8 months, with active listings more than doubling to 64.
Pearl City-Aiea Condos
Condo sales in Pearl City-Aiea decreased by 13% to 254, with a 3% decrease in the median price to $461,000. Condos took twice as long to sell, averaging 22 days. The bid-up percentage decreased by 19% to 33.9%. MRI more than doubled to 3.1 months, with active listings almost doubling to 66.
Summary
Because real estate market conditions can vary greatly among Oahu market areas, it's important for buyers and sellers to partner with a Realtor who has access to detailed, neighborhood-level data.
Glossary
- Active Listings: Count of MLS listings with "Active" status on the last day of the period.
- Bid-Up %: The percent of sales that were bid-up over asking price in competitive offers.
- Days on Market (DOM): Median number of days between listing date and escrow date, for all properties sold in the period.
- Months of Remaining Inventory (MRI): The number of months it would take to sell out the current active inventory at the recent rate of sales. A balance point between supply and demand is considered to be around 6 months, so MRI below 6 months indicates more of a sellers market and MRI above 6 months indicates more of a buyers market.


Congratulations, you have access to Hawaii's most comprehensive Real Estate Search! Please help us to better serve you by answering these optional questions.
Facebook Registration
This email is already registered. Click the button below and we'll send you a link to reset your password.
You have already registered using your FB account.
Check your inbox for an email from brokersmls@locationshawaii.com. It contains a link to reset your password.
The agent who gave you access to this website is no longer with Locations LLC.
Due to local MLS regulations, you will need to re-register if you would like to continue your access.
We will pre-fill the registration form with information in our files. Once you click Register you can either select a new agent or one will be assigned for you.
Sorry for the inconvenience, Locations LLC.
Schedule a Virtual Tour
Request an appointment to view this property by completing the information below. Please note your appointment is not confirmed until an agent calls you.
Disclaimer: The properties we may show you may be Locations LLC listings or listings of other brokerage firms. Professional protocol requires agent to set up an appointment with the listings agent to show a property. Locations, LLC may only show properties marked "Active" and "ACS".
Listings in
Additional Criteria
Keep your eye on this property! Save this listing and receive e-mail updates if the status of the property changes.
Share this property by completing the the form below. Your friend will receive an e-mail from you with a link to view the details of this property.
How can we help?
Send a message and we'll respond shortly.
We will not rent, share, or sell your information. Privacy Policy.
